Important update from TheSchoolRun
For the past 13 years, TheSchoolRun has been run by a small team of mums working from home, dedicated to providing quality educational resources to primary school parents. Unfortunately, rising supplier costs and falling revenue have made it impossible for us to continue operating, and we’ve had to make the difficult decision to close. The good news: We’ve arranged for another educational provider to take over many of our resources. These will be hosted on a new portal, where the content will be updated and expanded to support your child’s learning.
What this means for subscribers:
- Your subscription is still active, and for now, you can keep using the website as normal — just log in with your usual details to access all our articles and resources*.
- In a few months, all resources will move to the new portal. You’ll continue to have access there until your subscription ends. We’ll send you full details nearer the time.
- As a thank you for your support, we’ll also be sending you 16 primary school eBooks (worth £108.84) to download and keep.
A few changes to be aware of:
- The Learning Journey weekly email has ended, but your child’s plan will still be updated on your dashboard each Monday. Just log in to see the recommended worksheets.
- The 11+ weekly emails have now ended. We sent you all the remaining emails in the series at the end of March — please check your inbox (and spam folder) if you haven’t seen them. You can also follow the full programme here: 11+ Learning Journey.
If you have any questions, please contact us at [email protected]. Thank you for being part of our journey it’s been a privilege to support your family’s learning.
*If you need to reset your password, it will still work as usual. Please check your spam folder if the reset email doesn’t appear in your inbox.
What are axes?

What are axes?
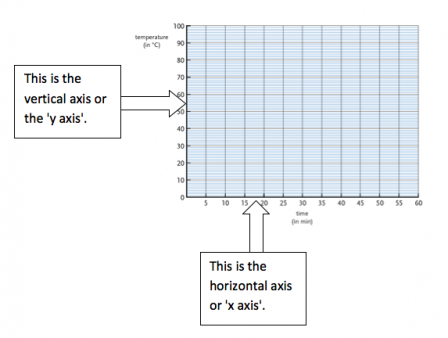
Using axes in diagrams and to plot coordinates
Children start looking at pictograms and bar charts in Key Stage 1. They will not be expected to name axes or understand what they are at this stage.
In Year 3, they will start to construct their own bar charts and pictograms. Some children will be given ready-drawn and labelled axes and more able children will just be given squared paper and asked to draw their chart from scratch.
In Year 4 children learn to read and plot coordinates on a grid with an x axis and a y axis.
As children move into upper Key Stage 2, they will be required to draw and label their own axes. For example, they may have collected the following information:
| Time | Length of my shadow / cm |
| 9am | 320cm |
| 10.30am | 190cm |
| 12 noon | 70cm |
| 1.30pm | 150cm |
| 3pm | 205cm |
- Faced with a squared A4 sheet of paper, they will need to think about whether it is best to have the paper landscape or portrait.
- They will need to draw their axes, making sure to leave plenty of space at the bottom and left-hand side for labelling.
- They will need to be aware that whenever time is involved, it goes along the horizontal axis.
- Since the times above are spaced evenly, they will need to space their five markings for each time evenly, making sure that they spread out the length of the horizontal axis so the graph is not too cramped.
- Before labelling the vertical axis, they will need to think about the highest value in the right hand column of their table. The highest value is 320cm, so it may be a good idea to mark the axis so it goes up to 350cm.
- The tricky bit is deciding what number to count up in and how they will mark these values on. Say their vertical axis is 15 squares high. They may decide to count up in 50s. Since there will be seven jumps from 0 to 350, it may be a good idea to mark each point every two lines.
Drawing up bar charts and graphs takes a lot of practice. Children may need plenty of support before they can do this on their own.


