Important update from TheSchoolRun
For the past 13 years, TheSchoolRun has been run by a small team of mums working from home, dedicated to providing quality educational resources to primary school parents. Unfortunately, rising supplier costs and falling revenue have made it impossible for us to continue operating, and we’ve had to make the difficult decision to close. The good news: We’ve arranged for another educational provider to take over many of our resources. These will be hosted on a new portal, where the content will be updated and expanded to support your child’s learning.
What this means for subscribers:
- Your subscription is still active, and for now, you can keep using the website as normal — just log in with your usual details to access all our articles and resources*.
- In a few months, all resources will move to the new portal. You’ll continue to have access there until your subscription ends. We’ll send you full details nearer the time.
- As a thank you for your support, we’ll also be sending you 16 primary school eBooks (worth £108.84) to download and keep.
A few changes to be aware of:
- The Learning Journey weekly email has ended, but your child’s plan will still be updated on your dashboard each Monday. Just log in to see the recommended worksheets.
- The 11+ weekly emails have now ended. We sent you all the remaining emails in the series at the end of March — please check your inbox (and spam folder) if you haven’t seen them. You can also follow the full programme here: 11+ Learning Journey.
If you have any questions, please contact us at enquiries@theschoolrun.com. Thank you for being part of our journey it’s been a privilege to support your family’s learning.
*If you need to reset your password, it will still work as usual. Please check your spam folder if the reset email doesn’t appear in your inbox.
How to draw and interpret pie charts

What is a pie chart?
Pie charts are used in data handling and are circular charts divided up into segments which each represent a value.
Pie charts are divided into sections (or 'slices') to represent values of different sizes. For example, in this pie chart, the circle represents a whole class. Each member of the class was asked what their favourite subject was, so each segment of the circle represents a different favourite subject: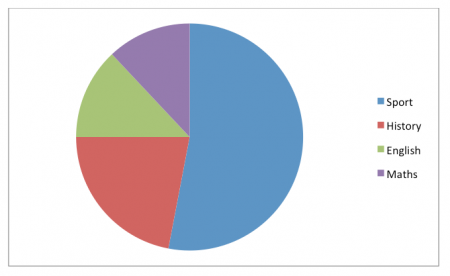

Pie charts are a visual device to help us understand data more easily. For example, in this pie chart we can see that sport was the most popular subject as more than half of the class said it was their favourite subject.
Pie charts and percentages and angles
Pie charts often label each segment with a percentage, so it is vital that children understand percentages before they can properly interpret pie charts.
For example: a pie chart showing the favourite fruit of children in one class, may have 3 segments, showing strawberries as 55%, bananas as 39% and blueberries without a percentage. Children would need to work out the percentage of children who liked blueberries by taking 55% and 39% away from 100. The remaining number (6) would be the missing percentage.
Children would also need to know that if a quarter of the pie chart is clearly marked, this represents 25%. If half the pie chart is clearly marked, this represents 50%.
Children in Year 6 will sometimes be given a question on a pie chart that relies on their knowledge of angles, for example:
In order to answer questions about this pie chart they would need to know that the data about Tony is shown on a right-angled section which therefore means it represents 25% or a quarter of the information given. Kaias's section is half or 50% of the data. If James represents 5% then Hugo must represent 20%.
In Year 6, children will learn how to construct pie charts. For example: they may be asked to represent 'half' on a pie chart by drawing a vertical or horizontal line across its centre. They may be asked to represent 'a quarter' by using a protractor to measure an angle of 90° and then draw a line segmenting this off.
More able children may be asked to relate their knowledge of percentages to their knowledge of angles. For example, to represent 30% on a pie chart, they would need to work out what 30% of a full turn (360°) is. They would then need to measure this angle on the pie chart with their protractor (108°), draw a line and then label the segment correctly.


