Important update from TheSchoolRun
For the past 13 years, TheSchoolRun has been run by a small team of mums working from home, dedicated to providing quality educational resources to primary school parents. Unfortunately, rising supplier costs and falling revenue have made it impossible for us to continue operating, and we’ve had to make the difficult decision to close. The good news: We’ve arranged for another educational provider to take over many of our resources. These will be hosted on a new portal, where the content will be updated and expanded to support your child’s learning.
What this means for subscribers:
- Your subscription is still active, and for now, you can keep using the website as normal — just log in with your usual details to access all our articles and resources*.
- In a few months, all resources will move to the new portal. You’ll continue to have access there until your subscription ends. We’ll send you full details nearer the time.
- As a thank you for your support, we’ll also be sending you 16 primary school eBooks (worth £108.84) to download and keep.
A few changes to be aware of:
- The Learning Journey weekly email has ended, but your child’s plan will still be updated on your dashboard each Monday. Just log in to see the recommended worksheets.
- The 11+ weekly emails have now ended. We sent you all the remaining emails in the series at the end of March — please check your inbox (and spam folder) if you haven’t seen them. You can also follow the full programme here: 11+ Learning Journey.
If you have any questions, please contact us at [email protected]. Thank you for being part of our journey it’s been a privilege to support your family’s learning.
*If you need to reset your password, it will still work as usual. Please check your spam folder if the reset email doesn’t appear in your inbox.
What is a Venn diagram?

What is a Venn diagram?
A Venn diagram shows the relationship between a group of different things (a set) in a visual way. Using Venn diagrams allows children to sort data into two or three circles which overlap in the middle. Each circle follows a certain rule, so any numbers or objects placed in the overlapping part (the intersection) follow both rules.
Venn diagrams in KS1
Venn diagrams encourage children to sort objects or numbers according to given criteria. Learning how to sort begins in Key Stage 1, when teachers may ask a child to sort a group of objects into two groups according to certain rules. For example, they may be given these shapes and asked to put them into either one of the following two circles:

Venn diagrams in KS2
A Venn diagram is when the two sorting circles overlap in the middle. Children need to think about how to sort something according to the two rules. For example, they might be asked to sort the numbers 5, 8, 10, 25 and 31 in the following Venn diagram:

In this example, 10 would go in the circle on the left (it's in the 5x table but not an odd number), 5 and 25 would go in the intersection (they are both part of the 5x table and odd numbers), 31 would go in the circle on the right (it's an odd number and not in the 5x table) and 8 would be outside the circles (it doesn't fit the criteria of this Venn diagram).
More advanced activities involving Venn diagrams might include reading bar charts or using their knowledge of multiples to find information to sort into a Venn diagram.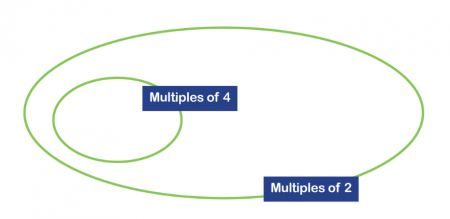
Venn diagrams are a great way to combine skills: children can practise data-handling while learning about properties of shapes or number facts.


