Important update from TheSchoolRun
For the past 13 years, TheSchoolRun has been run by a small team of mums working from home, dedicated to providing quality educational resources to primary school parents. Unfortunately, rising supplier costs and falling revenue have made it impossible for us to continue operating, and we’ve had to make the difficult decision to close. The good news: We’ve arranged for another educational provider to take over many of our resources. These will be hosted on a new portal, where the content will be updated and expanded to support your child’s learning.
What this means for subscribers:
- Your subscription is still active, and for now, you can keep using the website as normal — just log in with your usual details to access all our articles and resources*.
- In a few months, all resources will move to the new portal. You’ll continue to have access there until your subscription ends. We’ll send you full details nearer the time.
- As a thank you for your support, we’ll also be sending you 16 primary school eBooks (worth £108.84) to download and keep.
A few changes to be aware of:
- The Learning Journey weekly email has ended, but your child’s plan will still be updated on your dashboard each Monday. Just log in to see the recommended worksheets.
- The 11+ weekly emails have now ended. We sent you all the remaining emails in the series at the end of March — please check your inbox (and spam folder) if you haven’t seen them. You can also follow the full programme here: 11+ Learning Journey.
If you have any questions, please contact us at [email protected]. Thank you for being part of our journey it’s been a privilege to support your family’s learning.
*If you need to reset your password, it will still work as usual. Please check your spam folder if the reset email doesn’t appear in your inbox.
What is a block graph?

What is a block graph or block diagram?
In KS1 children find out information and learn to present it in a block graph (or block diagram) where types of items are shown on the x axis (horizontal), number of items are shown on the y axis (vertical) and one block represents one item.
For example, they may be asked to carry out a traffic survey, where they have to keep a tally of all the cars, bikes, lorries, buses and motorbikes that they see on the road going past the school. 
They will then be given a chart made up of squares with number on the left hand side and the names of the vehicles along the bottom. They will need to look at the tally they have taken and then colour the correct number of squares for each vehicle so that their finished block diagram looks something like this: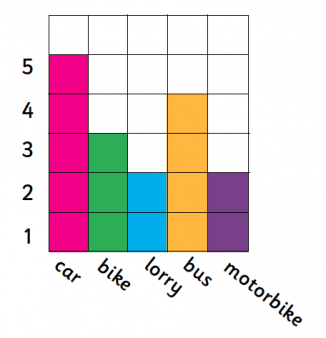
More able children may just be given the squares and then asked to label the numbers and names of vehicles themselves.
How are block diagrams used in the classroom?
The whole class may be asked these types of questions about a block diagram:
- Which vehicle did you see the most?
- Which vehicle did you see the least?
- How many more cars than lorries did you see?
- How many vehicles did you see altogether?
The teacher may also discuss with them the difference between presenting their information as a tally and as a block diagram. They may talk about which is the better representation of the data and why.
Graduating from block graphs to bar charts
Working with block graphs is the foundation for learning about bar charts. It helps to familiarise children with the concept of numbers on the vertical axis and labels on the horizontal axis.
When drawing a bar chart, children will need to think about how wide the bars are and whether they are going to have gaps between each bar. A block diagram is easier, as it just involves colouring, but introduces children very early on to a visual portrayal of the information they have gathered.
Block diagrams may be used as part of cross-curricular learning, for example: the children may have a geography lesson about traffic where they take the tally, then use their maths lesson to draw up the block diagram, then have a literacy lesson where they write a recount of the investigation they have carried out.

Learning about data handling in primary school
Find out about all the charts, diagrams and tables used to record information in primary school, plus worksheets, games and hands-on practice activities.


